The State of the Global Climate report, published annually by the World Meteorological Organization, compiles multiple datasets to describe changes in the climate system — temperature, ocean heat, ice, greenhouse gases and extreme events — and reports observed impacts. Its value for decision-makers is that it establishes a global baseline. Its limits lie in the same place: a global baseline differs from a local forecast, and the distance between the two is where risk actually lives.
What the global record is good for
A global record is essential for detecting the direction and pace of change. Individual weather events are noisy; a single hot year proves little. But a consistent, multi-dataset record over decades shows trends that are robust to any one measurement. The report’s careful use of several independent datasets is what gives it authority: when different methods agree, confidence rises. For international policy, this baseline is the reference against which commitments are judged.
Why global averages are not local experiences
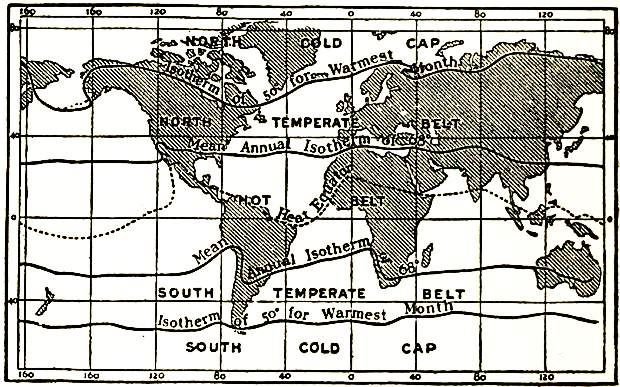
A global mean temperature rise of a fraction of a degree says nothing about what happens in a particular valley. Warming is uneven: land heats faster than oceans, the Arctic faster than the tropics, and some regions may cool temporarily while the average rises. Rainfall changes are even more variable. A farmer’s risk depends on the timing of rains, the frequency of heat extremes and the behaviour of a local watershed — none of which can be read off a global figure.
From attribution to adaptation
Attribution science asks how much more likely or severe a given event became because of climate change. This is useful for understanding causes and, increasingly, for legal and financial questions. But adaptation decisions need something different: projections at the scale of a city, a river basin or a coastline. Downscaled models and local observation networks provide that, and they are far less developed than the global picture. The gap between global knowledge and local planning capacity is one of the practical bottlenecks in adaptation.
Each year’s report catalogues notable extremes: heatwaves, floods, droughts, storms. It is tempting to read a single dramatic year as proof of a trend, or a quiet year as evidence against one. Neither is sound. Extremes are noisy, and the signal emerges over time. The report’s framing is careful for this reason: it reports events and impacts alongside the longer record, rather than treating any one season as decisive.
Impacts are not evenly distributed
The same physical change produces very different consequences depending on exposure and capacity. A heatwave in a city with universal air conditioning and strong health systems is a different event from the same heatwave where housing is poor and outdoor work is common. That is why the report pairs physical data with observed impacts: the hazard is global, but the disaster is local and shaped by development.
What decision-makers should take from it
Use the global record to understand direction and urgency, then invest in local data and local planning. The most useful question is not “what is the global temperature anomaly?” but “what does the trend imply for this coastline, this crop, this water supply?” Answering that requires downscaled projections, historical local records and engagement with the communities affected. The global baseline sets the context; the local analysis sets the response.
The State of the Global Climate is a rigorous account of a system-wide trend, and it offers no guide to any one place. Treat it as the opening chapter of a local risk assessment, not as the assessment itself. The work of translating a global signal into a local decision is where climate science meets public policy, and it remains unevenly done.
The data gap that shapes the picture
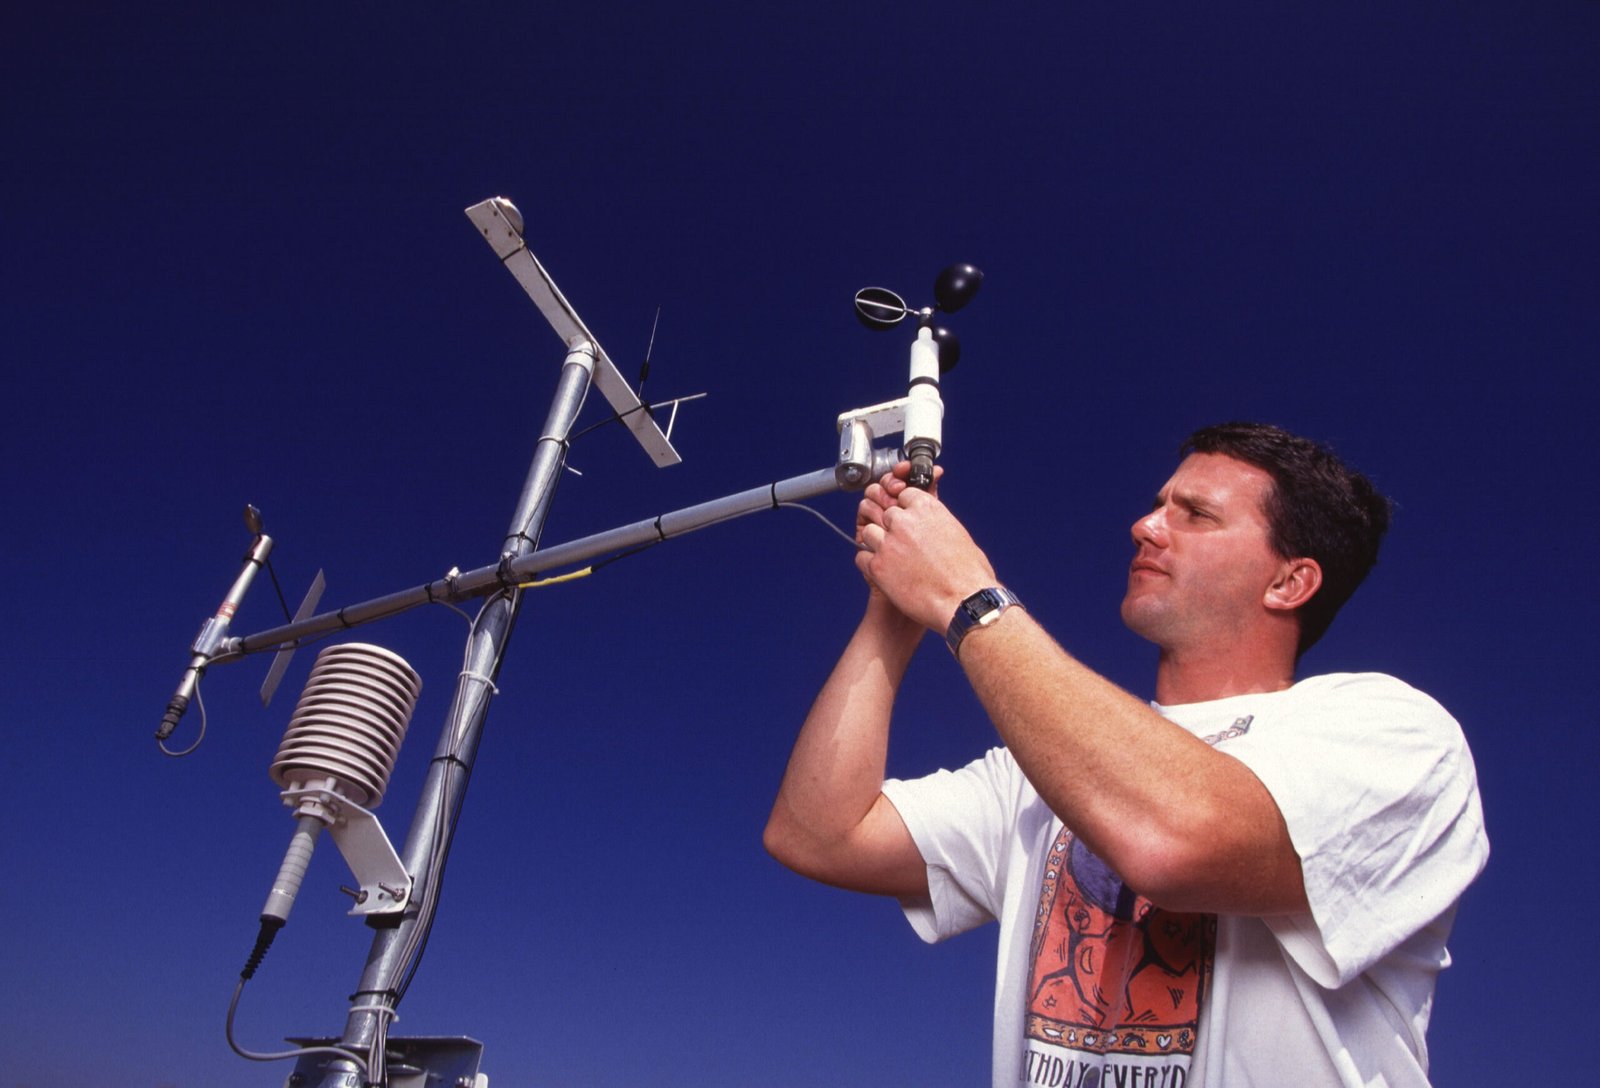
The global record is built from observation networks that are unevenly distributed. Weather stations, ocean buoys and research programmes cluster in wealthier countries, leaving parts of Africa, South America and the oceans thinly covered. Models fill the gaps, but the underlying data is sparser where the need for local projections is often greatest. This is a quiet inequity in climate science: the regions most exposed to climate risk are frequently the ones with the least local observational data to plan with. Closing that gap is as much a development priority as an environmental one.
How cities can use the global record
Cities are where climate impacts concentrate, and they are increasingly using the global record as a starting point for local planning. The typical approach combines downscaled projections with local vulnerability data — which neighbourhoods flood, which populations are most exposed to heat, which infrastructure is most fragile. The global report supplies the direction of travel and the urgency; the local analysis supplies the response. Where cities skip the local step and plan only against global averages, they tend to under-invest in the places that will actually be hit hardest.
Source material
- World Meteorological Organization (WMO). State of the Global Climate. wmo.int
- IPCC. Assessment Reports. ipcc.ch
Image: European Union, Copernicus Sentinel-2 imagery · Attribution · via Wikimedia Commons.