The UN Environment Programme’s Emissions Gap Report is often summarised as a single number: how far projected emissions are from a pathway consistent with agreed temperature goals. That number is important, and it is easy to misread. The report’s real contribution is not the size of the gap but the structure of the analysis behind it — the scenarios, assumptions and choices that determine whether the gap closes or widens.
What the gap actually compares
The gap is a difference between two things: where emissions are heading if current policies and pledges are fully implemented, and where they would need to be to keep warming within agreed limits. Both sides are estimates, not observations. The first depends on assumptions about growth, technology and policy follow-through; the second on a carbon budget derived from climate science. Comparing them is informative precisely because it forces those assumptions into the open.
Pledges versus policies
A recurring distinction is between what countries have promised and what they have legislated. A pledge that is not backed by policy does not change emissions. The report therefore separates scenarios that assume full delivery of announced targets from those based only on implemented measures. The difference between the two is a measure of ambition, and also of credibility. Closing the gap requires both raising ambition and turning promises into law.
Why a single number can mislead
Headline gaps are often quoted without their conditions. A gap of a certain size in 2030 assumes that certain pledges are met, that technologies scale as expected, and that land-use emissions behave in a particular way. Change any assumption and the number moves. This does not make the report unreliable; it makes it a scenario exercise, and scenarios are meant to be read with their assumptions attached.
Assumptions do a lot of work in emissions modelling. The pace of renewable deployment, the cost of storage, the rate of energy-efficiency improvement, the behaviour of methane from agriculture and waste — each is uncertain, and each shifts the projected path. Where the report is most useful is in showing which assumptions matter most and what would have to be true for the gap to close. That turns a daunting number into a set of identifiable levers.
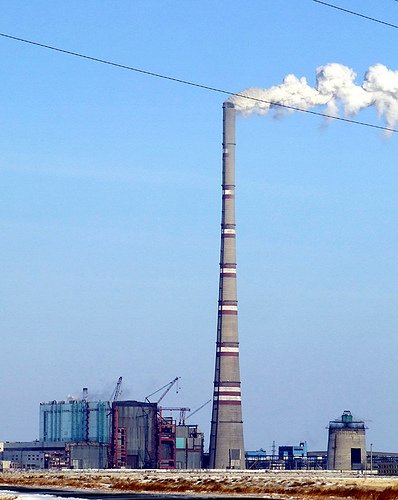
Sectors and the shape of the gap
Emissions are not a single stream. Energy supply, industry, transport, buildings, agriculture and land use each contribute differently, and each faces different obstacles. A gap that looks impossible in aggregate may be more tractable when broken down: some sectors have mature, cheap abatement options, while others depend on technologies still being demonstrated. The structure of the gap determines which policies can deliver in the near term and which require long bets.
Fairness and the distribution of effort
How the remaining carbon budget is shared is a political question as much as a scientific one. Countries differ in historical responsibility, current emissions and capacity to invest. The report does not resolve this, but it makes the arithmetic visible: some allocations imply rapid reductions in high-emitting economies, and others imply delayed action that shifts the burden to the future. The choice of pathway is a choice about who acts first.
Three things recur in the analysis: stronger near-term policy, faster deployment of existing solutions, and credible plans for the harder sectors. Delay is costly because it raises the required rate of change later and increases reliance on technologies that are not yet proven at scale. The gap is a statement about time as much as about tonnes.
The arithmetic of delay
Read the Emissions Gap Report for its structure, not just its headline. It tells you which assumptions drive the outcome, which sectors are hardest, and how much of the task has been deferred. That is more useful than a single figure, because it identifies where action would change the result.
Technology assumptions and risk
Many pathways to closing the gap rely on technologies that are either not yet commercial or not yet deployed at the required scale: long-duration storage, clean hydrogen, industrial processes, and in some scenarios, carbon removal. Treating these as certainties is risky. If they arrive more slowly or cost more than assumed, the burden shifts back to measures that are available now. A prudent reading of the gap therefore distinguishes between what can be deployed today and what is hoped for later, and treats over-reliance on the latter as an additional risk rather than a plan.
Not all warming comes from long-lived carbon dioxide. Methane, black carbon and other short-lived pollutants trap heat intensely while they persist, and cutting them can slow warming within decades rather than centuries. That makes them attractive targets for near-term action, and they feature prominently in scenarios that aim to keep goals within reach. The practical difficulty is that many of these emissions come from dispersed sources — agriculture, waste, inefficient combustion — which are harder to regulate than a power station. The opportunity is real, but so is the implementation challenge.
This report draws on the UN Environment Programme’s Emissions Gap Report.
Image: Adina Voicu and User:GST HBK · CC0 · via Wikimedia Commons.